This is a short quantitative writing piece I did for a statistical research methods lab. It is a shortened version of a results and discussion section. I looked at data concerning performance anxiety, so the analyses I ran look for the impact of performance anxiety and difficulty level of the music (and their interactions) on their performances.
Research Methods Lab Report
Results:
I ran a regression for five standardized independent variables. Performance Anxiety, Difficulty of Music, the interaction between them, a quadratic term for Performance Anxiety and an interaction between the quadratic term and Difficulty of significantly predicted Rated Performance, β = -4.33, t(162) = -3.16, p < .001; β = -2.12, t(162) = -5.25, p < .001; β = 7.31, t(162) = 4.65, p < .001; β = 5.76, t(162) = 4.23, p < .001; β = -7.77, t(162) = -5.49, p < .001. This model explained a significant proportion of variance in Rated Performance, R2 = .783, F(5, 162) = 117.214, p < .001. The regression equation for the first model was zPredicted Rated Performance = -4.33(zPerformance Anxiety) + -2.12(zDifficulty of Music) + 7.31(zInteraction) + 5.76(zPerformance Anxiety Squared) + -7.77(zPerformance Anxiety Squared by Difficulty) + 5.47E-15. See Table 1.
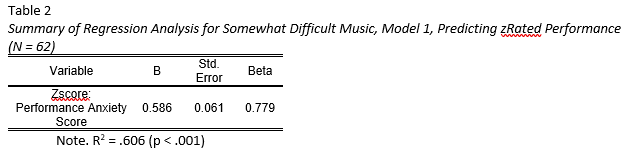
Three separate two model Regressions were run, on each level of difficulty that had values. First was the somewhat difficult music. The first model, the linear model, fit the data better and significantly predicted zRated Performance, β = .59, t(60) = 9.61, p < .001. This model explained a significant proportion of variance in Rated Performance, R2 = .606, F(1, 60) = 92.39, p < .001. The regression equation for the first model was zPredicted Rated Performance = .59(zPerformance Anxiety) + .768. See Table 2.
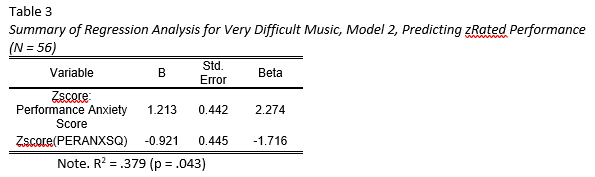
Next was the very difficult music. In this level, the second model, the quadratic model, fit the data better and both zPerformance Anxiety and ZPerformance Anxiety Squared significantly predicted zRated Performance, β = 1.21, t(56) = 2.74, p < .01; β = -.92, t(56) = -2.07, p = .043. This model explained a significant proportion of variance in Rated Performance, R2 = .379, F(2, 53) = 16.18, p < .001. The regression equation for the first model was zPredicted Rated Performance = 1.21(zPerformance Anxiety) + -.921(zPerformance Anxiety Squared) – .062. See Table 3.
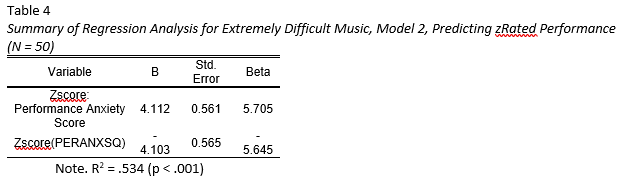
Finally the extremely difficult music was run. In this level, like the last, the second model, the quadratic model, fit the data better and both zPerformance Anxiety and ZPerformance Anxiety Squared significantly predicted zRated Performance, β = 4.11, t(50) = 7.34, p < .001; β = -4.10, t(50) = -7.26, p < .001. This model explained a significant proportion of variance in Rated Performance, R2 = .534, F(2, 47) = 26.92, p < .001. The regression equation for the first model was zPredicted Rated Performance = 4.11(zPerformance Anxiety) + -7.26(zPerformance Anxiety Squared) – .95. See Table 4.
Discussion:
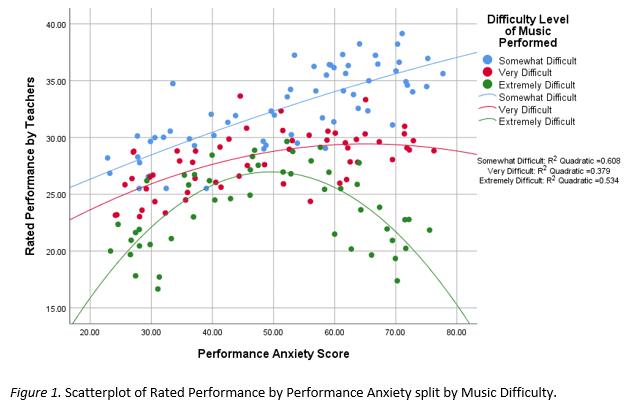
In determining what the best fit equation for predicting Rated Performance, I found first that Performance Anxiety and Music Difficulty along with their interaction, performance anxiety squared and performance anxiety squared by difficulty successfully predicted rated performance. More specifically, I looked at the best fit line for each level of music difficulty. I found that as the level of music got higher, a quadratic fit was increasingly better than a linear one, see Figure 1. This means that with easier music performance anxiety has a positive effect on rated performance, but when the music is harder, too much performance anxiety lowers rated performance.