A Comparison Over Time of Mystic Seaport Beaches with Respect to Species Diversity and Physical Characteristics
Zach Arfa & Arturo Claudio
Abstract:
Habitat fragmentation is a growing issue that entails the breaking up of the area where species live. We chose to focus our study on the Mystic Seaport Museum beaches in the Mystic Estuary, with the hopes of replicating and adding to a previous study conducted by Kate Knopp in 1983. We looked at the species found within the beaches and the overall area and physical characteristics of said beaches, comparing our data in 2019 to Knopp’s in 1983. We found significant results for the beaches that were fragmented and marginally significant results in species richness. Beaches that were split have less surface area in 2019 and there were fewer species living on the beaches in 2019. We also collected sediment composition, temperature and salinity data from our sites, that could be used in further analyses. Hopefully there will be further systematic studies of the Mystic Seaport Museum’s beaches to significantly add to the growing body of knowledge surrounding habitat fragmentation and this estuary.
Intro:
Habitat fragmentation is a serious concern in conservation practices. Habitat fragmentation is when the area where species live is broken up spatially. (Franklin et al., 2002). Usually through landscape modification, habitat fragmentation is a key driver of species loss (Fischer & Lindenmayer, 2007). As of 2015, 70% of the remaining forests in the world are within 1km of the forest’s edge (Haddad et al., 2015); this problem permeates the globe. Haddad et al. (2015) also found that habitat fragmentation reduces biodiversity from 13-75%, decreases biomass, and alters nutrient cycles. These trends are even worse in vulnerable estuarine environments. Humans have depleted more than 90% of formerly important species in estuaries, and greater than 65% of wetland and seagrass habitat (Lotze et al., 2006). Global climate change also exacerbates these trends (Waycott et al., 2009).
Increased severe weather events have eroded and reshaped coastal environments at increasing rates (Michener et al., 1997). Since 1983, the ocean has, conservatively, risen about a centimeter (Cazenave & Llovel, 2009). But the seas are rising disproportionately; they are rising about 3-4 times faster on the northeast coast of the U.S. (Sallenger Jr. et al., 2012). Globally, we see the urgency to implement structures used to combat the threat of coastal flooding, in places such as the Oshiwara River in Mumbai, India where the flood hazard area has increased by 22% (Zope et al., 2016). This case is not rare and is important especially for coastal and urban communities as the consequences of climate change may lead to the change of these communities’ landscapes and the organisms that make up the biomass of them. Combined, the forces of human-made habitat fragmentation and climate change pose a significant threat to estuarine environments.
Global statistics don’t capture the effects that these changes will have on local communities; and the effect that they have already had. In 1983, Kate Knopp surveyed beaches along the waterfront at the Mystic Seaport Museum (Knopp, 1983) to document the species diversity and physical characteristics of the beaches. Since then, no systematic survey of the beaches has been done. Our goal is to describe how the fragmented beaches that Knopp studied have changed over the last forty years as the climate has changed. The Mystic Seaport has been home to lots of waterfront access, as well as many estuarine intertidal organisms. The amount of access and biodiversity, as well as other abiotic factors, have only been measured at the Seaport once, in 1983. Our question is what changes have happened in Mystic Seaport Estuary since 1983? To answer this, our study focused on the species diversity of both plants and animals and the physical characteristics of the beaches themselves. We hypothesize that there will be less surface area of the beaches and less species found at these beaches.
If our hypothesis is correct, we will find fewer numbers of beaches from which to access the water at the sites Knopp studied perhaps due to direct landscape alterations or natural processes. We expect to also find that the remaining beaches are smaller and more fragmented Potentially, we expect to find fewer species that live on the beaches than originally observed in 1983. Furthermore, if we find our hypothesis is supported, we expect to see further weathering and erosion of the Mystic Seaport’s beaches and subsequent renovations of piers and seawalls as well as changes to the ecosystem in and around the estuary. To test this hypothesis, we intend to conduct a similar study to that of Kate Knopp’s, collecting measurements of the remaining beaches she studied as well as observing a presence/absence of species in these beaches.
Methods:
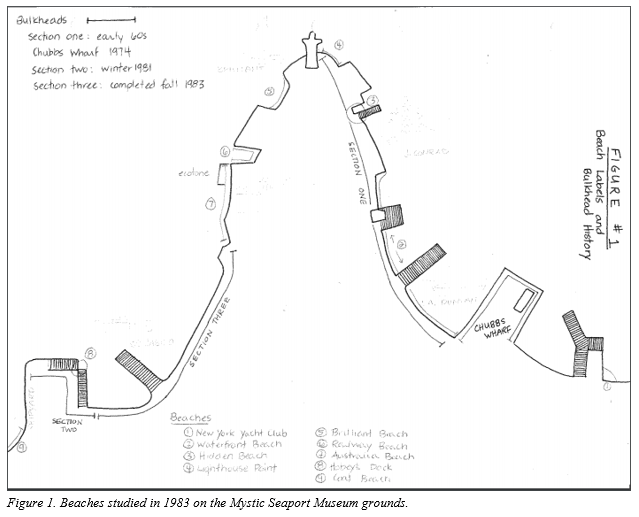
In accordance with the original experiment, we conducted various measurements on the original beaches of Mystic Seaport. The nine beaches Knopp studied were called NYC Beach, Waterfront Beach, Hidden Beach, Lighthouse Point, Brilliant Beach, Railway Beach, Australia Beach, Hobey’s Dock and Coal Beach (Knopp, 1983). See Figure 1 for a map of the Seaport Museum grounds, with Knopp’s beaches pointed out. We went to the beaches close to low tide, to measure them most accurately. The methods of collection replicated Knopp’s original study. We first “simply observe(ed)” (Knopp, 1983) the beaches she outlined, and recorded which were still there, which had been altered, and which are no longer here. We recorded “the basic physical outlay (and) geography” (Knopp, 1983) of each beach by, as Knopp did, measuring the length and width of the sites in meters, and then calculating the area in square meters, along with simply observing the prominent physical features and locations of the beaches. In some cases there were no remnants of beaches from Knopp’s original study.
We then sampled the beaches for “biological data” (Knopp, 1983). We recorded the surface temperature and salinity with a YSI at each beach. We recorded both values at each beach to add to the data gathered for future researchers, as well as using the temperature and salinity recorded throughout the semester from the Seaport dock. We noted visibly predominant species, and anything not immediately identifiable we took pictures of to be identified later with reference materials. We sampled each beach for species richness, the presence/absence of species. We used a quarter meter by quarter meter quadrat to sample the beaches. We divided each length by six, except for Brilliant Beach, or beach number 5, which we divided by three, and placed that many quadrats evenly spaced on each beach. At each beach, we also collected a sediment sample from three of the quadrats, selected randomly with Google’s random number generator. The samples were dried at lab and then sieved for the composition of the beaches for percentages of gravel, sand, and clay/silt.
To compare our results to Knopp’s, we used a few different methods. For the physical characteristics of the beaches, we noted the status of the beaches, were they still there relatively the same, were they split apart or were they gone altogether. We observed the measurements previously mentioned for further comparison in our study. We also used paired sample t-tests on the areas in square meters of the beaches. In order to compare our data to Knopps in both surface area and species, we combined the beaches that were split into two in 2019. For the biological data, Knopp only recorded species richness in presence/absence. To compare our data, we summed the number of species she found and what we found, doing plants and animals separately and together, and then ran paired sample t-tests. Again, for the split beaches we did not combine redundant species, but combined non-redundancies. The sediment composition, temperature and salinity we simply reported, because they are analyses that Knopp didn’t do.
Results:
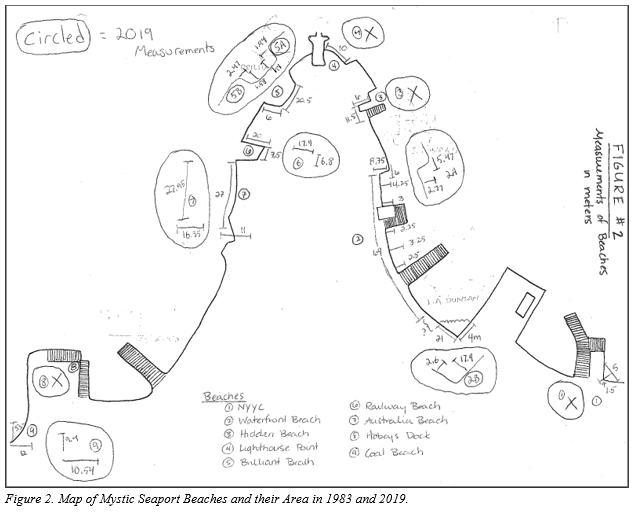
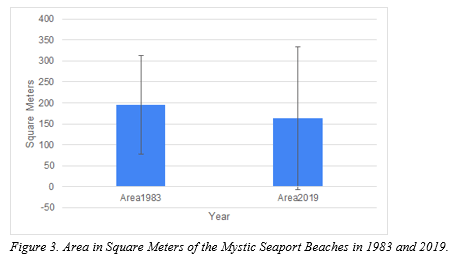
We started by comparing the physical area of the beaches. The first, most obvious observation are the differences between the number and locations of the beaches. Five beaches from Knopp’s original study remain, Waterfront Beach, Brilliant Beach, Railway Beach, Australia Beach and Coal Beach. Four beaches that were studied in Knopp’s original study, Hidden Beach, Lighthouse Point, NYYC Beach and Hobey’s Dock are no longer there. Two of the beaches, Brilliant Beach and Waterfront Beach, have been split and now are two smaller beaches each (Figure 1). In comparing the area, we combined the area of each of these pieces of beach so as to get to exactly how much land was lost. First we ran a paired sample t-test using just the surviving beaches that we measured. Despite two of her beaches being split, the total area in square meters between the 1983 beaches and the 2019 beaches was not significantly different (t-stat =0.511, p-value = 0.636). Figure 2 shows the comparison between the total area then and now. We then included the beaches that disappeared, excluding Hobey’s Dock because Knopp did not include measurements in her study. With these beaches included, there was still no significant difference in the area of the beaches (t-stat =0.806, p-value = 0.447).
Next, we ran a test to see if there was a difference in the amount of area lost between beaches that were split and beaches still intact. We divided the beaches into three groups, beaches that were no longer here, beaches that were two smaller beaches in 2019, and intact beaches. We ran an ANOVA to see if the land lost from beaches that were split or gone in 2019 was statistically significant. There was less area remaining on those beaches (f-stat = 4.558, p-value = 0.027).
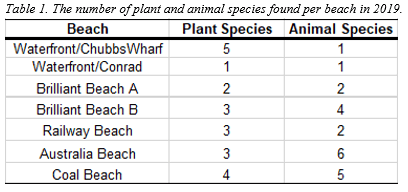
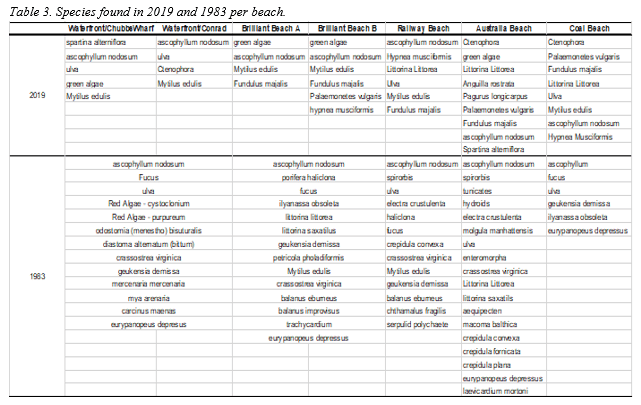
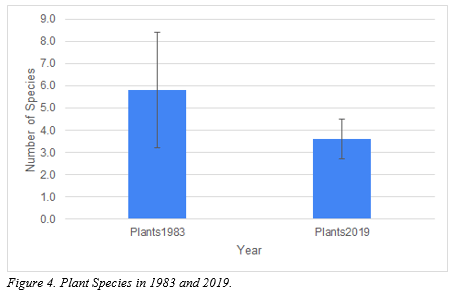
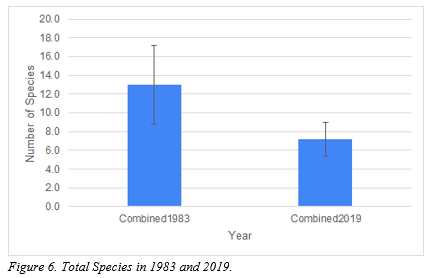
Next, we compared the species found on the beaches. The number of species found in 2019 can be found in Table 1. To compare we ran three paired samples t-tests, on the plant species, animal species, and then the total species found. There was no statistically significant difference in the number of plant species found (t-stat =1.580, p-value = 0.189). Both the animal species and the combined species were marginally significant (animals, t-stat =2.167, p-value = 0.096; combined, t-stat =2.610, p-value = 0.059) (Figures 3, 4 and 5). The means and standard deviations can be found in Table 2, there were fewer species in all three categories in 2019 than in 1983. The specific species found in 1983 and in 2019, for the beaches we were able to survey in 2019, see Table 3.
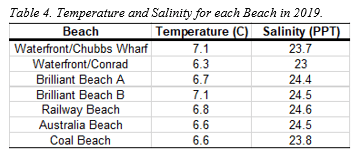
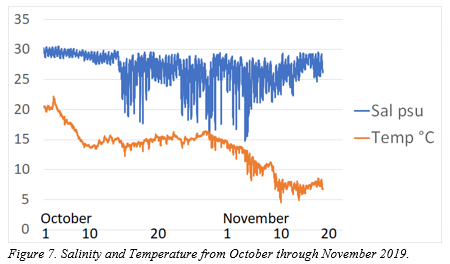
We measured the salinity and temperature over the course of October and November from the Mystic Seaport dock. We also tested the salinity and temperature once for each beach. Knopp measured the salinity four times over her project, and she didn’t collect temperature data, so we couldn’t compare our results to hers. Our temperature and salinity data for each beach can be found in Table 3 and the temperature and salinity over the semester can be found in Figure 6. The temperature steadily looks to have gone down, while the salinity doesn’t seem to have a distinctive pattern.
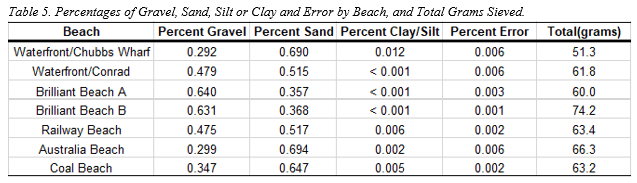
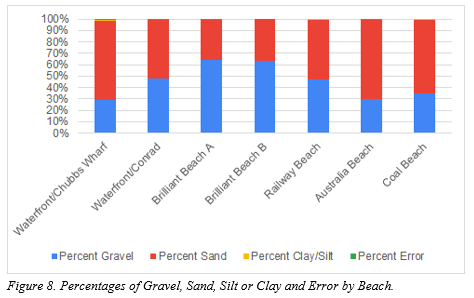
Finally, we looked at the composition of the sediment at each beach. We sieved a sample from each beach, and looked at how much was gravel, how much was sand and how much was silt. These values can be found in Table 4 and Figure 7. We couldn’t run any statistical tests to compare the beaches because we only have one data point for each, so our only conclusions were drawn by eye. It seems that the two beaches that used to be Brilliant Beach have quite similar compositions, whereas the two beaches that used to be a part of Waterfront Beach looked more different. Australia Beach, Waterfront/Chubbs Wharf and Coal Beach had the most sand, where Brilliant Beach A and B had the most gravel. None of the beaches had more than a few tenths of a gram of silt or clay.
Discussion:
We did find some effects in line with our original hypothesis, though they were not unquestionably conclusive. Initially, the most observable differences lie within the features and landscapes of some of the beaches in the original study. Where some beaches, such as Waterfront and Brilliant, have been split and separated by water, others like Hidden Beach, Lighthouse Point, NYYC Beach, and Hobey’s Dock have disappeared. Despite these observations, there was no significant difference between the overall area in 1983 and 2019. One possible reason for no significant difference being found, was that Australia Beach was actually measured as quite bigger in 2019. This may be due to fill being added by the Museum, or our measurements taking place at a lower tide; regardless, this made the total areas closer than they would have been if Australia had followed the pattern of being smaller in 2019. Upon closer inspection however, when we looked just at the beaches that had been lost or split, we did find that there was a significant difference in the area of those beaches. Even though the Seaport didn’t lose a statistically significant amount of beach overall, we can see that it has lost enough area over the course of these 36 years to split and alter the beach habitat.
The analysis of various species of plants and animals found in and around the beaches of the Mystic Seaport Estuary has suggestive evidence supporting this conclusion as well. While we found no truly significant difference in either plants or animals, we found data that was suggestive of less species today than there were in 1983. In plant species, there was no difference between Knopp’s study and our own. When we looked at species of animals, we found evidence only suggestive of a difference between Knopp’s study and ours. Similarly, when we combined all species found, the result was also marginally significant, almost meeting the threshold for significance. We can make inferences as to how these differences are meaningful. In each case, there were less species today than there were in 1983. Habitat fragmentation can lead to decreased species richness, so this tentative result would be supported by what we know of the effects of habitat fragmentation. When looking at the specific species in 1983 and 2019, these patterns are also supported. The seaweeds found were very similar between 1983 and 2019. The biggest difference in animals weren’t simply that there were more in 1983, though there were, but there was increased diversity of different families and genuses. Knopp found several kinds of crabs, like the green crab and the mud crab (carcinus maenas and eurypanopeus depressus), whereas we only found the common long-wristed hermit crab (pagurus longicarpus), and no other crab species.
When looking at the sediment composition, it seems that the two beaches that used to be Brilliant Beach have quite similar compositions, whereas the two beaches that used to be a part of Waterfront Beach looked more different. The two Waterfront beaches also appeared much more different to each other observationally than the two Brilliant Beaches. This could be because overall, Brilliant Beach was much smaller than Waterfront. So the two smaller beaches that used to be Brilliant are almost right adjacent to each other Australia Beach, Waterfront/Chubbs Wharf and Coal Beach had the most sand, where Brilliant Beach A and B had the most gravel. Australia Beach has the most obvious sand to the eye, the other beaches appeared much muddier. It looks like Australia Beach has had sand brought in and added to it. For temperature, as the months go on the water gets steadily colder, this is to be expected as fall turns to winter in New England. It was harder to see a pattern in the salinity.
This study is the first to take a longitudinal look at change over time of the beaches at the Mystic Seaport Museum. This helps us get a picture of this habitat, estuarine beaches in a developed area, as well as how it’s changed and is changing. Despite not being completely unequivocal, there is certainly evidence that some beaches are getting smaller, and that the number of species, particularly animal species, are decreasing. They aren’t simply decreasing, a few of the remaining species are becoming more widespread, like periwinkles and mussels. For instance, Knopp found both ribbed mussels and blue mussels (geukensia demissa and mytilus edulis) at several beaches, where in 2019 we only found blue mussels attached to the rocky walls of the Museum, not the ribbed mussels that can sometimes imbed in sediment or marshy spartina plants. This effect, the dominance of few widespread species, has been noted before in habitat fragmentation literature, especially around highly developed areas like the Mystic Seaport Museum (Bilkovic & Roggerto, 2008). Furthermore, our current understanding of the effects of habitat fragmentation emphasize how context-dependent the said effects are (Didham, 2010). When looking at a relatively small system like individual beaches on an estuary, there are likely many effects on a scale too small for our study to pick up. This is one reason why it’s so important to research further the effects of habitat fragmentation on estuaries.
One limitation of this study was that each beach was surveyed only once. This means it’s possible there was an error in the beach measurements, depending on the exact stage of the tide. We also weren’t able to record every individual plant or animal we saw, so it is possible that there may have been more species than one in a group we observed and recorded as one. This study not only reveals information about the beaches in 2019 and how they’ve changed, it can help track future changes. The Seaport Museum may take on new development projects, or future storms might alter the beaches dramatically. Just as this study was based on Kate Knopps’, future studies may be based on this one. This will continue to help track these beaches and habitat. Our updated information, including the sediment composition and the more detailed temperature and salinity data, can be used to measure even more variables over time in the future. That is what makes this analysis so important, the potential to increase the body of knowledge and the observation that is involved that could lead to further acknowledgement of the broad problems of climate change and the specific effects i.e. habitat fragmentation and difference in biodiversity.
Acknowledgements:
Our huge thanks to Tim Pusack for guiding this project, and to Lisa Gilbert and Laurie Warren for much practical support along the way!
References:
- Bilkovic, DM, MM Roggerto (2008) Effects of coastal development on nearshore estuarine nekton communities, Marine Ecology Progress Series, 358:27-39
- Cazenave, A, W Llovel (2010) Contemporary Sea Level Rise, Annual Review of Marine Science, 2:145-173
- Didham, RK, (2010) Ecological Consequences of Habitat Fragmentation, eLS
- Fischer, J, DB Lindenmayer (2007) Landscape modification and habitat fragmentation: a synthesis, Global Ecology and Biogeography, 16: 265–280
- Franklin, AB, BR Noon, TL George (2002) What is Habitat Fragmentation?, Studies in Avian Biology, 25: 20–29
- Haddad, NM, LA Brudvig, J Clobert, KF Davies, A Gonzalez, RD Holt, … JR Townshend (2015) Habitat fragmentation and its lasting impact on Earth’s ecosystems, Science Advances, 1
- Hettiarachchi, S, C Wasko, A Sharma (2018) Increase in flood risk resulting from climate change in a developed urban watershed – the role of storm temporal patterns, Hydrology & Earth System Sciences, 22: 2041–2056
- Knopp, K (1983) A Survey of Mystic Seaport Beaches with Respect to Species Diversity and Physical Characteristics, Williams-Mystic Maritime Studies Program Science Research Project Archives, Fall 1983: Full Report
- Lotze, HL, HS Lenihan, BJ Bourque, RH Bradbury, RG Cooke, MC Kay, … JBC Jackson (2006) Habitat fragmentation and its lasting impact on Earth’s ecosystems, Science, 312: 1806–1809
- Michener, WK, ER Blood, KL Bildstein, MM Brinson, LR Gardner (1997) Climate Change, Hurricanes and Tropical Storms, and Rising Sea Level in Coastal Wetlands, Ecological Applications, 7; 770-801
- Sallenger, AH, KS Doran, PA Howd (2012) Hotspot of accelerated sea-level rise on the Atlantic coast of North America, Nature Climate Change, 2: 884–888
- Waycott, M, CM Duarte, TJB Carruthers, RJ Orth, WC Dennison, S Olyarnik, … SL Williams (2009) Accelerating loss of seagrasses across the globe threatens coastal ecosystems, Proceedings of the National Academy of Sciences, 106: 12377–12381
- Zope, PE, TI Eldho, V Jothiprakash (2016) Impacts of land use–land cover change and urbanization on flooding: A case study of Oshiwara River Basin in Mumbai, India, CATENA, 145: 142–154
Figures

Tables